The importance of Core Web Vitals for Google ranking stems from Google’s commitment to enhancing the user experience on the web. Core Web Vitals are a set of specific factors that Google considers crucial in a webpage’s overall user experience. These metrics are part of Google’s “page experience” signals, influencing a website’s rankings.
Why Core Web Vitals Matter for Google Rankings:
Core Web Vitals are essential for Google rankings as they directly impact user experience, a focus of Google’s ranking algorithm. These metrics, measuring loading speed (LCP), interactivity (FID), and visual stability (CLS), are crucial for providing a positive user experience.
Websites with better Core Web Vital scores tend to rank higher, especially with the emphasis on mobile-first indexing. Optimizing these metrics is key for improving SEO, enhancing visibility in search results, better engagement, and gaining a competitive edge.
Core Web Vitals are pivotal in aligning website performance with Google’s user-centric approach to search rankings.
What are Core Web Vitals?
Core Web Vitals are a set of specific metrics developed by Google to help quantify the user experience of a web page, with a focus on three main aspects: loading performance, interactivity, and visual stability.
Let us look at each one of them one by one.
1. Largest Contentful Paint (LCP)
- What It Measures: LCP assesses the loading performance of a webpage. It measures the time from when the page starts loading to when the largest content element in the viewport is rendered. The largest element is often an image, video, or block of text.
- Why It’s Important: LCP is a user-centric metric that indicates the perceived load speed of the page. A fast LCP reassures users that the page is useful and helps in retaining their attention.
- Ideal Benchmark: For a good score, LCP should occur within 2.5 seconds of when the page first starts loading.
2. First Input Delay (FID)
- What It Measures: First Input Delay or FID measures the interactivity of a webpage. It captures the time from when a user first interacts with a page (like clicking a link or tapping a button) to when the browser can actually process event handlers in response to that interaction.
- Why It’s Important: First Input Delay is critical for understanding how users perceive the responsiveness of a webpage. A low FID helps ensure that the page feels responsive and interactive.
- Ideal Benchmark: For a good score, FID should be 100 milliseconds or less.
3. Cumulative Layout Shift (CLS)
- What It Measures: CLS quantifies the unexpected movement of visible elements within the viewport. This metric records each unexpected layout shift that occurs during the lifespan of the page.
- Why It’s Important: CLS addresses the visual stability of a page. High CLS can be frustrating and disorienting for users, as it leads to elements moving around unexpectedly, which can result in accidental clicks and unhappy users.
- Ideal Benchmark: A page should maintain a CLS of 0.1 or less to ensure good visual stability.
4. Interaction to Next Paint (INP)
- What It Measures: INP is a more recent addition that measures the responsiveness of a webpage by capturing the delay between user interactions and the subsequent visual update or painting of the page. Unlike FID, which only considers the first input, INP assesses all interactive events and captures more complex interactions.
- Why It’s Important: INP provides a more comprehensive understanding of a page’s interactivity and responsiveness, especially for interactions that involve longer processing times or significant updates to the page’s content.
- Ideal Benchmark: For a page to rate high on responsiveness, INP should be less than 200 ms.
Interaction to Next Paint or INP is replacing First Input Delay (FID) as a Core Web Vital Metric from March 2024.
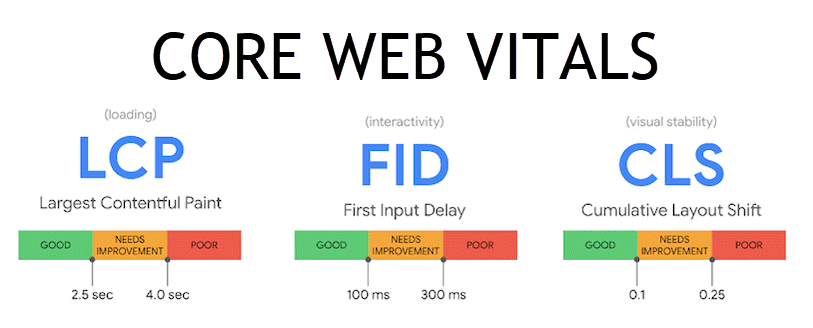
| Metric | Good | Needs Improvement | Poor |
|---|---|---|---|
| Largest Contentful Paint (LCP) | <= 2.5 seconds | <= 4 seconds | > 4 seconds |
| First Input Delay (FID) | <= 100 ms | <= 300 ms | > 300 ms |
| Cumulative Layout Shift (CLS) | <= 0.1 | <= 0.25 | > 0.25 |
| Interaction to Next Paint (INP) | <= 200 ms | <= 500 ms | > 500 ms |
Here’s a useful video on the Core Web Vitals:
Understanding the Impact of Core Web Vitals
Core Web Vitals significantly impact Google’s search engine optimization (SEO) and rankings as they are integral components of Google’s “Page Experience” signals.
Here’s how Web Vitals influence SEO and rankings:
1. Emphasis on User Experience:
- Google’s ranking algorithm increasingly focuses on the overall user experience. Core Web Vitals specifically measure critical aspects of this experience – loading performance (LCP), interactivity (FID, INP), and visual stability (CLS).
- Pages offering a better experience are likely to rank higher in search results, as indicated by good Web Vitals. This is because Google aims to direct visitors to pages with relevant content and a positive and efficient browsing experience.
2. Direct Ranking Factors:
- In May 2021, Google began using Core Web Vitals as direct ranking factors. This means that these metrics are part of the algorithms used to determine the position of websites in search results.
- Websites that optimize for these vitals can see a boost in their search rankings, while those with poor scores may experience a drop in their rankings.
3. Mobile-First Indexing:
- With the shift to mobile-first indexing, where Google predominantly uses the mobile version of content for indexing and ranking, the performance of websites on hand-held devices has become crucial.
- The Web Vitals are particularly important for SEO, as they directly influence pages’ loading time, interactivity, and visual stability on these smaller devices.
4. Impact on User Engagement:
- Conversely, optimizing the Web Vitals can lead to better engagement, longer session durations, and lower bounce rates, which are positive signals to Google about the quality and relevance of the site.
5. Enhancing Competitive Edge:
- In competitive niches, where many sites have similar content quality and relevance, a website’s Core Web Vitals can be a decisive factor in search rankings.
- Websites that are optimized for these metrics may gain a significant edge over competitors in search results.
6. Influence on Conversion Rates:
- While not a direct SEO factor, improved user experience through better Core Web Vitals can lead to higher conversion rates. This indirectly benefits SEO, as higher user engagement and conversions can lead to increased trust and authority, which are important for search rankings.
Measuring Your WordPress Website’s Core Web Vitals
Various tools are available to effectively measure these vitals, each providing unique insights and metrics.
Key Tools for Measuring Core Web Vitals:
- Google PageSpeed Insights:
- An online tool that evaluates a webpage’s performance for both mobile and desktop.
- Provides detailed lab and field data, along with optimization suggestions.
- Lighthouse:
- An automated, open-source tool is available in Chrome DevTools, via CLI, or as a Node module.
- Offers performance audits, including detailed reports and actionable recommendations.
- Chrome User Experience Report (CrUX):
- A public dataset that provides real-user performance data from millions of websites.
- Useful for understanding how a WordPress website performs on Core Web Vitals across various conditions globally.
- Web Vitals Chrome Extension:
- A simple extension for Chrome that gives real-time Core Web Vitals feedback.
- Ideal for quick checks and ongoing monitoring during web development.
- Google Search Console:
- A free tool provided by Google that helps monitor, maintain, and troubleshoot a website’s presence in search results.
- Includes a Web Vitals report that identifies pages on a website that need improvement based on real-world usage.
The insightful diagnostics and specific optimization strategies to improve the Web Vitals can help you fine-tune your WordPress website for better performance.
Regular use of these tools, especially Search Console, aids in continuously monitoring and maintaining a website’s health in relation to Core Web Vitals, ensuring compliance with evolving web standards.
Tips for Testing Core Web Vitals
When you are testing for the Vitals – there are two types of data that you can look at Field and Lab Data.
- Field Data: This reflects real-world visitor experiences of your website based on the Chrome User Experience Report (CrUX). It shows how the page has performed over the last 28 days, including Core Web Vitals (LCP, FID, INP, CLS).
- Lab Data: This is generated in a controlled environment and provides more detailed information about how a page might perform. It includes metrics like First Contentful Paint (FCP), Time to Interactive (TTI), and LCP and CLS.
Test Multiple Pages: Don’t just test your homepage. Analyze various pages across your website, especially those with high traffic or critical for conversions.
Mobile and Desktop Performance: Some of these tools will provide separate mobile and desktop performance scores. Since Google uses mobile-first indexing, pay special attention to these results.
Continuous Monitoring: Regularly monitor your site with PSI, as your site and the web environment (like browser updates) constantly evolve.
1. Google PageSpeed Insights
PageSpeed Insights (PSI) is a powerful tool for measuring Core Web Vitals and overall WordPress website performance. Here’s a step-by-step guide on how to use it effectively:
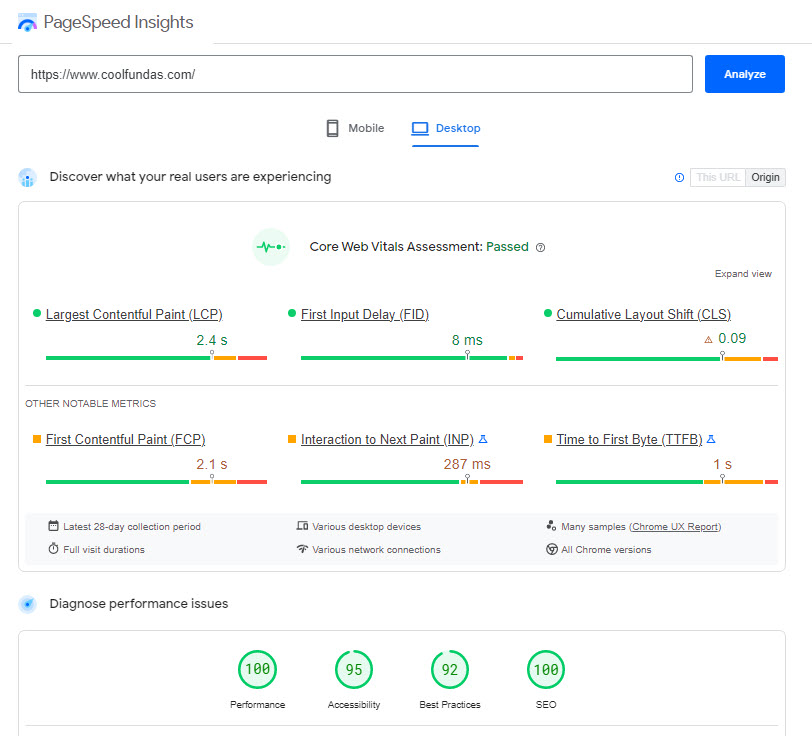
- Navigate to the Tool: Go to the PageSpeed Insights website.
- Enter the URL: Type in the URL of the webpage you want to analyze. PSI can evaluate any accessible webpage, not just the homepage.
- Run the Analysis: Click the “Analyze” button to start the evaluation process. PSI will take a few moments to analyze the page.
- View the Results: The results are divided into two main categories – field and lab data.
- Optimization Suggestions: PSI will provide a list of opportunities and diagnostics to help improve the page’s performance. These might include optimizing images, removing unused CSS, or reducing server response times.
- Apply Changes: Work with your web development team to deploy the suggested optimizations.
- Re-test Regularly: After making changes, use the tools to re-test the page and track improvements.
2. Lighthouse
Lighthouse is an open-source, automated tool developed by Google, available in Chrome DevTools. It’s designed to audit web pages in terms of performance, accessibility, progressive web apps, SEO, and more. Here’s how you can use Lighthouse, specifically focusing on Core Web Vitals:
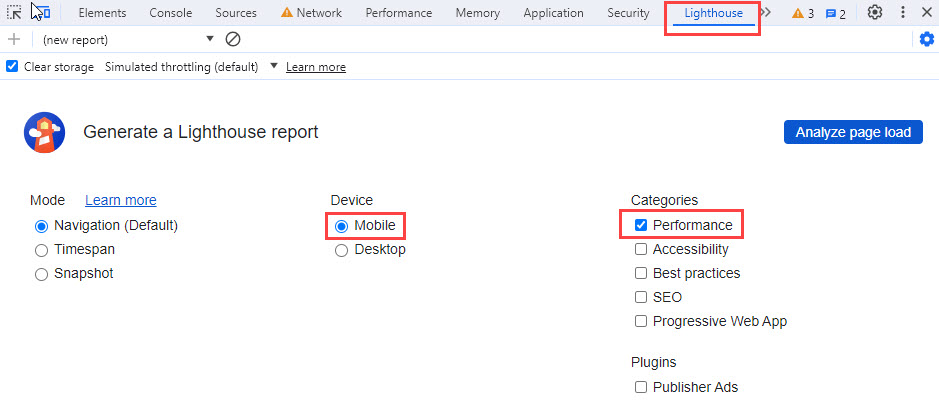
- Open Chrome Browser: Ensure you’re using the Chrome browser.
- Navigate to Your Web Page: Go to the web page you want to audit.
- Open DevTools: Right-click anywhere on the page and select “Inspect,” or use the shortcut
Ctrl+Shift+I(orCmd+Opt+Ion Mac). - Find the Lighthouse Tab: In the DevTools window, locate the “Lighthouse” tab.
- Choose Test options: In Lighthouse, you can select various categories for the audit, including Performance, Accessibility, Best Practices, SEO, and Progressive Web App. For the Web Vitals, ensure ‘Performance’ is checked. You can choose between mobile and desktop audits.
- Start the Audit: Click the “Analyze Page Load” button. Lighthouse will then run a series of tests on the page.
- Review, Fix, and Re-Test: Review the suggestions, work with your technical team to fix any identified issues or errors, and re-test to validate the fixes.
Chrome extensions can negatively affect this test, so make sure you audit the page in incognito mode or from a Chrome profile without extensions.
3. CrUX Dashboard
Using the Chrome User Experience Report (CrUX) Dashboard is a great way to understand how your website performs in terms of Core Web Vitals based on real-world user data.
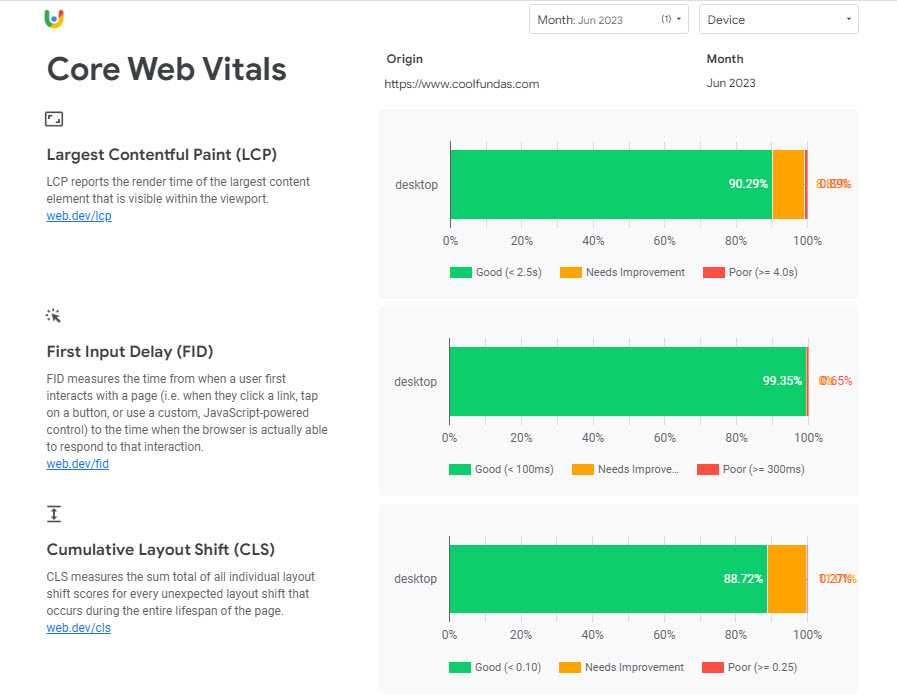
Here’s a step-by-step guide to using the CrUX Dashboard:
- Go to Google Data Studio: The CrUX Dashboard is built on Data Studio. Go to the CruX Dashboard page.
- Enter Your Website Information: On the dashboard, you’ll see an option to enter the URL of your website. Input the full URL of the site or page you want to analyze.
- LCP, FID, and CLS: Choose these metrics one at a time to see how your site performs in each area. The dashboard will show the percentage of page loads in each category (good, needs improvement, poor) as defined by Google’s benchmarks.
- Compare Over Time: Look at the trends over time to see if there have been any significant changes. This could be in response to site updates, changes in user behavior, or other external factors.
- Drill Down by Device: Analyze if there are differences in Core Web Vitals based on device type. This can help you identify if optimizations are needed for specific device segments.
- Identify Areas for Improvement: Use the insights from the CrUX Dashboard to identify areas where your site’s Web Vitals could be improved.
- Prioritize Based on Impact: Focus on metrics that show a larger percentage of users in the ‘needs improvement’ or ‘poor’ categories.
CrUX data is best for sites with significant traffic. For smaller sites, the data might not be comprehensive. CrUX reports are also updated monthly so they won’t reflect recent changes.
I highly recommend you also use lab data from tools like Lighthouse or PageSpeed Insights for immediate feedback on potential optimizations.
Using the CrUX Dashboard provides valuable insights into how real users experience your website, specifically regarding Core Web Vitals. This information can be crucial for prioritizing performance improvements and ensuring a positive user experience.
4. Web Vitals Chrome Extension
Using the Web Vitals Chrome Extension is an efficient way to measure the Core Web Vitals of a web page in real time.
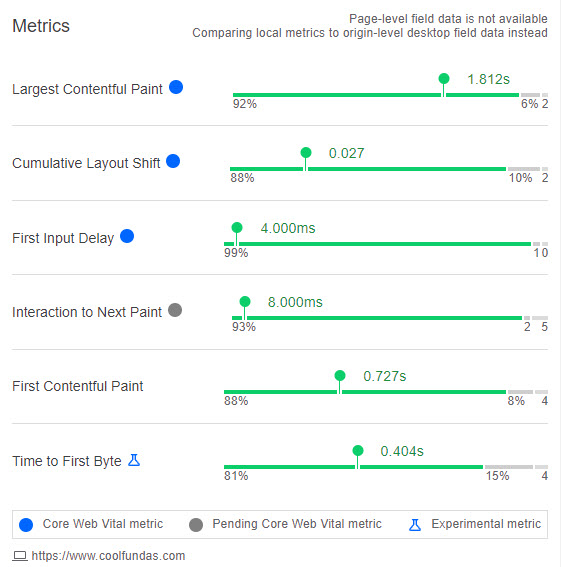
Here is a step-by-step guide on how to use this extension:
- Install the Extension: Go to the Web Vitals Extension page on the Chrome Web Store. Click “Add to Chrome” to install the extension.
- Access the Extension: Once installed, you’ll see the Web Vitals icon in your Chrome browser’s extension toolbar. If you don’t see the icon, click on the puzzle piece icon in the toolbar and pin the Web Vitals extension for easy access.
- Open a Web Page: Navigate to the web page you want to test. Ensure the page is fully loaded for accurate measurements.
- View Core Web Vitals: Click on the Web Vitals extension icon. The extension will display real-time metrics for the page, including LCP, CLS, FID, INP, FCP, and TTFB.
- Analyze the Results: The extension provides a simple, color-coded system (green, yellow, red) to indicate performance for each metric. Green indicates a good score, yellow needs improvement, and red is poor.
Use the extension for real-time monitoring while you browse. It’s particularly useful during development or after deploying changes to a site.
For metrics like FID and INP, interact with the page (like clicking or scrolling), as this metric requires user interaction to be measured.
The Web Vitals extension has some limitations – The extension provides lab data – simulated user experience rather than real user experience, so it’s best used for development and debugging purposes.
Metrics are based on the Chrome experience and may not represent how the page performs on other browsers.
The Web Vitals Chrome Extension is a handy tool for developers, designers, and site owners to quickly check the Core Web Vitals of any webpage they are browsing, aiding in ongoing site performance monitoring and optimization.
5. Google Search Console’s Core Web Vital Report
GSC provides a dedicated report for Core Web Vitals, helping website owners understand how their pages perform based on real-world usage data.
Here is a step-by-step guide to access GSC’s Core Web Vitals:
- Log into Search Console: Navigate to Search Console and sign in with your account. If you haven’t already, you’ll need to add and verify your website in GSC.
- Navigate to the Core Web Vitals Report: Find and click on the “Core Web Vitals” report on your GSC dashboard under the “Experience” section.
- Overview of the Report: The report is divided into two sections: mobile and desktop, reflecting the performance of pages on each type of device. It categorizes pages into three statuses: Good, Needs Improvement, and Poor, based on their Core Web Vitals scores (LCP, FID, CLS, and INP).
- Identify Issues: The report shows the number of pages that fall into each category. Click on any category to see specific issues affecting your pages. For each issue, GSC gives you the details of the error, the number of affected URLs, and examples of impacted pages.
- Investigate Specific Issues: Select an issue to view the affected URLs. This helps you understand which pages need optimization. GSC provides details about what is causing the error, such as a slow LCP or a high CLS.
- Validate Fixes: After the issues are fixed, you can use the “Validate Fix” button in GSC. This tells Google to re-crawl your pages and reassess their Core Web Vitals. The validation process can take time as it waits for real-user data to be collected.
Advantages of Using Search Console
- Real-User Data: The Core Web Vitals report in GSC is based on field data, representing how actual users experience your site.
- Device-Specific Insights: Separate reports for mobile and desktop help you optimize for both types of devices.
- Direct Integration with Google’s Algorithms: Understanding how Google views your site’s performance can directly influence your SEO strategy.
Core Web Vitals using Javascript
If you are technically inclined, you can also track Core Web Vitals through JavaScript. This tracking is done with the help of conventional web APIs. For example, web developers can take advantage of the web-vitals JavaScript library. This library offers an effortless way to measure each metric with function calls. You can find more information on the process in this Github documentation.
These Website monitoring tools measure the performance of WordPress websites in real time. With this data, web developers optimize their sites. This ensures visitors have the best possible experience.
How do I fix Core Web Vitals issues in WordPress Websites?

Now you’ve figured out how to monitor and measure these metrics. It’s time to understand how to fix Core Web Vitals metrics to optimize performance and speed up your WordPress site.
Optimize the Largest Contentful Paint (LCP)
- Upgrade your web hosting infrastructure: Good quality and a fast hosting provider closer to the region of your end users. Deploy a Content Delivery Network – CDNs store copies of your content at multiple, geographically diverse data centers to reduce delays in loading content due to distance (and better LCP).
- Remove heavy page elements and set up lazy loading: PageSpeed Insights indicates such elements on your page. They slow down your LCP. Lazy loading sets up your screen, so images only load when the reader scrolls down your page.
- Minify your CSS, JS, and HTML files: Bulky CSS Files can significantly delay LCP times. Minification will reduce the size of the files.
- Preload Important Resources and Defer non-critical third-party scripts: Use the
preloadattribute in your HTML to prioritize loading key resources that are crucial for LCP. Third-party JS scripts don’t add value and add to the processing time (and hence higher LCP), so delay such scripts. - Use Modern Image Formats: Formats like WebP often provide better compression than traditional formats like JPEG or PNG.
Optimize First Input Delay (FID)
- Leverage browser caching: Page loading speeds dramatically increase when you use browser cache. This boost in speed happens since server trips get reduced.
- Optimize and Defer JavaScript or JS Loading: Minimize the amount of JavaScript loaded on your page and defer the loading of non-critical JavaScript until needed.
- Load Third-Party Scripts Asynchronously: Ensure third-party code is loaded asynchronously or deferred to minimize their impact on interactivity.
- Use Preloading Techniques: Preload key resources to speed up their availability.
- Implement Server-Side Caching: Caching HTML pages will reduce server response times.
- Database Optimization: Regularly optimize your database to reduce data retrieval times.
Update: Interaction to Next Paint (INP) will replace the metric FID starting March 2024.
Optimize Cumulative Layout Shift (CLS)
- Add UI elements below the fold: As the page loads on the user, content stays where it is and doesn’t get pushed down.
- Ad spaces should be predetermined: As pages load in the user’s browser, content may shift down or side where the ads suddenly appear. This doesn’t help the CLS score.
- Use set size attribute dimensions for all media (like video and images): It helps if the browser knows exactly how much space each media element will need. Ads appearing in an ad-hoc manner could push away the content. In such a manner, media also can contribute to poor CLS scores.
- Use Font Display Swap: For web fonts, use
font-display: swapin your CSS to reduce layout shifts caused by font loading. - Test Across Devices and Browsers: Layout shifts might behave differently across various screen sizes and browsers.
Optimize Interaction to Next Paint (INP)
The INP Metric will go live only in March 2024, but it is a good idea to start now and ensure your website is getting good scores for this metric. Search Console is already tracking this and will let you know if any of the pages are falling short on the INP Metric.
- Break Up Long Tasks: Split long-running JavaScript tasks into smaller, asynchronous chunks to prevent them from blocking the main thread.
- Minimize Unused JavaScript: Remove or lazy load JavaScript that isn’t necessary for the initial user interactions.
- Optimize Processing Time: Minimize CSS animations and avoid third-party fonts
- Minimize Presentation Delay: Optimize your web pages, and reduce the DOM size. Larger DOMs mean more rendering work and higher processing times. So the more optimized or leaner your DOMs are, the faster browsers can process and render them.
You can read the following articles for a more detailed discussion on optimizing each of the core web vitals.
Optimize LCP | Optimize FID | Optimize CLS | Optimize INP
General Mitigation Strategies
A number of issues or suggestions outlined above can be mitigated up-front to a large extent by following a few key mitigation strategies:
- Use a Fast WordPress hosting solution: A fast hosting solution will give you an immediate boost for better web vitals. Try Kinsta, Cloudways, or Rocket.net.
- Use a lightweight theme: A Lightweight theme will have less JavaScript or more optimized scripts. This reduces the time the browser needs to become interactive, thereby improving Core Web Vitals. Themes like GeneratePress, Neve, Astra, Sydney, and OceanWP are the ones to check out.
- Choose Optimized Builders: Select page builders known for clean, efficient code. Some builders are more performance-oriented than others.
- Limit Use of Add-Ons and Widgets: Excessive add-ons or widgets can add bloat. Use them sparingly and only when necessary.
- Optimize Images and Media: Use optimized media sizes and formats to reduce load times.
Use WordPress Plugins on your Site
Any good speed optimization WordPress plugins can address most of the recommendations above: You can easily configure plugins like WP Rocket or FlyingPress on your website to get better core web vital scores.
Additional Web Vitals
In addition to the Core Web Vitals, Google and web performance experts often focus on several other key web vitals metrics that provide additional insight into web performance.
They often serve as a proxy or supplemental metric to the Core Web Vitals.
- First Contentful Paint (FCP): FCP measures the time from when a page starts loading to when any part of the page’s content is rendered on the screen. It helps gauge how quickly a user sees something happening on the page.
- Time to First Byte (TTFB): TTFB measures the time it takes for a user’s browser to receive the first byte of page content from the server. This metric is crucial for understanding server response times and initial network latency.
- Time to Interactive (TTI): TTI measures the time from when the page starts loading to when it’s fully interactive. It helps you know how long a page takes to become fully functional for the user.
- Total Blocking Time (TBT): TBT is the time between FCP and Time to Interactive during which the main thread was blocked for a long enough time to prevent input responsiveness. It’s a measure of how non-interactive a page is while loading.
- Speed Index: This metric shows how quickly the contents of a page are visibly populated. It’s a user-centric metric for assessing the loading experience of a site beyond what’s captured with FCP or LCP.
Some of the above metrics are also used as a surrogate for one of the core web vitals.
For example, FID is a measure that relies on real-world data from actual users and cannot be simulated via a speed test. In the absence of FID, you can use Total Blocking Time or TBT as a proxy.
In a separate article, we will dive into these non-core web vitals in more detail.
Conclusion
Understanding and trying to optimize Core Web Vitals is not just about adhering to technical standards; it’s about enhancing the overall user experience, a crucial factor in today’s competitive digital landscape.
With a focus on aspects like efficient server response, optimized image and resource delivery, streamlined JavaScript execution, and ensuring visual stability, you can significantly boost your website’s performance.
Use a good optimization plugin to address majority of the recommendations, and work with your tech team to iterate and optimize your website by fixing any remaining issues.
This leads to a more engaging and satisfying user experience and aligns with Google’s commitment to prioritizing sites that offer such quality in its search rankings.
Remember, the world of web performance is ever-evolving. Regular monitoring, testing, and updating your WordPress site in line with the latest web performance practices is key to maintaining its edge.
Additional Resources: Here are a few useful resources if you want to know more about Web Vitals or are looking for solutions
- Web Vitals Guide: Web.dev’s introduction to Core Web Vitals, offering comprehensive insights.
- Stack Overflow: A valuable resource for asking specific technical questions and finding solutions related to Core Web Vitals. Stack Overflow


