Web performance metrics comprehensively evaluate a webpage’s delivery and rendering efficiency, focusing on the user experience during interaction with a webpage. They include a variety of measurements that assess different aspects of a site’s performance, such as how quickly content loads, how soon a page becomes interactive, and the stability of the page as it loads.
Core Web Vitals are a specific subset identified by Google as crucial for all web experiences. They include Largest Contentful Paint (LCP), First Input Delay (FID), and Cumulative Layout Shift (CLS), each addressing a distinct facet of user experience: loading performance, interactivity, and visual stability. These vitals are the ones that most people talk about since Google tracks them.
This does not mean that the other web vitals are not important. The non-core or other Web Vitals like FCP (First Contextual Paint), TTI (Time To Interactive), TTFB (Time To First Byte), TBT (Total Blocking Time), and Speed Index encompass a range of metrics that provide insights into various stages of a webpage’s loading and interactivity process.
Understanding the Other Web Vitals
While Core Web Vitals offer a focused view of key aspects of user experience, non-core or other Web Vitals provide additional context and depth, helping to identify and address broader performance issues.
- Understanding the User Experience: Non-Core Web Vitals encompass metrics that measure early loading indicators, server responsiveness, and the time until a page becomes fully interactive. They offer a broader perspective on how users perceive and interact with a website from the moment they request it.
- Initial Loading Experience: Metrics like First Contentful Paint (FCP) and Time to First Byte (TTFB) focus on the initial stages of loading. FCP gives insights into when the user first sees a visual response from the site, while TTFB measures the server’s responsiveness. Both are crucial for understanding the perceived speed of a site.
- Interactivity and Responsiveness: Time to Interactive (TTI) and Total Blocking Time (TBT) provide a deeper understanding of when a website becomes fully interactive and how non-interactive periods affect user experience. TTI measures the time until the main contents of a page are functional, while TBT quantifies the time during which the page is unresponsive to user input.
- Speed Index: This metric measures how quickly the contents of a page are visibly populated, indicating the user experience during the page load.
- Impact on User Engagement and SEO: While not directly part of Google’s Core Web Vitals, these metrics influence user satisfaction, engagement, and bounce rates. A site that loads quickly and becomes interactive without delays is more likely to retain users, potentially improving its SEO performance indirectly.
- Holistic Performance Optimization: Optimizing non-core Web Vitals and Core Web Vitals significantly improves site performance. This balanced approach ensures a website is optimized for search engines and provides an excellent user experience.
Exploring Key Non-Core Web Vitals
First Contentful Paint (FCP)
What is FCP?
First Contentful Paint (FCP) is a critical web performance metric that measures the time from when a page starts loading to when any part of the page’s content is first rendered on the screen. This could be text, images, SVGs, or non-white canvas elements.
FCP is an early indicator of page load speed and provides a snapshot of how quickly a website displays its content to users after they request it.
FCP supplements the Core Web Vital metric Largest Contentful Paint (LCP). While LCP focuses on when the largest content element in the viewport is rendered, FCP measures the time it takes for the very first piece of content to appear.
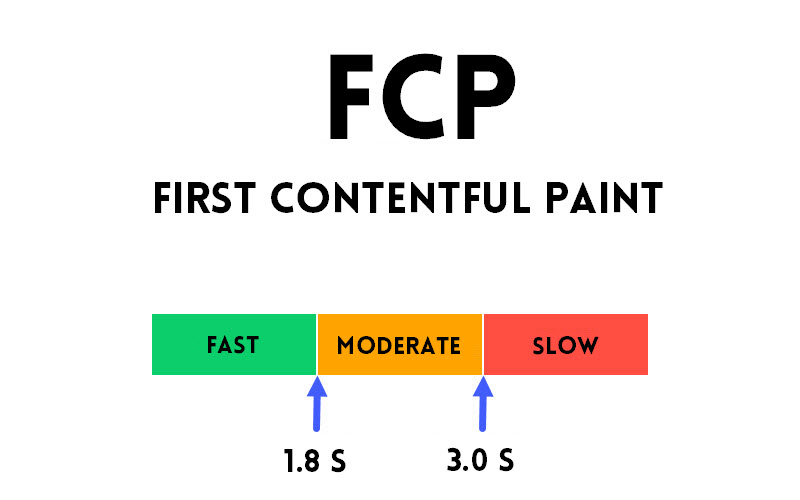
Together, these metrics give a comprehensive view of the loading experience from the initial paint to the main content’s full visibility. FCP is instrumental in understanding the perceived speed of a site, setting the stage for the user’s initial engagement.
How to Optimize FCP for Better Performance?
- Optimize Server Response Time: Upgrade your hosting solution, and use a Content Delivery Network (CDN)
- Minimize CSS and JavaScript Blocking Time: Minify and compress CSS and JavaScript files. Use critical CSS techniques and defer non-critical JavaScript and CSS.
- Optimize Resource Load Times: Prioritize loading of crucial resources using techniques like resource hinting (preload, prefetch).
- Efficiently Load Assets: Compress images and use modern, efficient formats like WebP. Implement lazy loading for images and media not critical to the initial user view.
- Reduce the Impact of Third-Party Scripts: Load third-party scripts asynchronously to avoid blocking the page’s critical rendering path.
By optimizing these areas, you can significantly improve the FCP of your website, leading to a better initial user experience and potentially positive impacts on user engagement and retention.
Time to Interactive (TTI)
What is TTI?
Time to Interactive (TTI) is a key web performance metric that measures how long it takes for a webpage to become fully interactive. TTI tracks the time from when the page starts loading to the point where it can reliably respond to user input quickly.
For a page to be fully interactive, it must display useful content (marked by the First Contentful Paint), event handlers must be registered for most visible elements, and respond to user interactions within 50 milliseconds.

TTI supplements the Core Web Vital First Input Delay (FID). While FID measures the response time of a website to a user’s first interaction, TTI provides a broader view by measuring the time it takes for the entire page to become interactive. FID captures the user experience for quick interactions after a page starts loading, whereas TTI encompasses the overall readiness of the page for any user interaction. Together, they offer a comprehensive understanding of a site’s interactivity and responsiveness from the initial load to full usability.
How to Optimize TTI for Better Performance?
- Minimize JavaScript Execution Time: Break up long JavaScript tasks into smaller, asynchronous chunks and defer the loading of non-critical JavaScript, allowing the browser to focus on critical tasks first.
- Optimize Critical Rendering Path: Identify and prioritize the loading of critical resources necessary for initial rendering.
- Reduce Server Response Times: Better hosting solutions, optimized server-side scripts, efficient database queries, and using a CDN will reduce latency.
- Remove or Optimize Third-Party Scripts: Audit and minimize the impact of third-party scripts, which can significantly affect TTI. Load third-party scripts asynchronously or defer their loading to ensure they do not block the page’s interactivity.
- Use Lazy Loading: Employ lazy loading for images, offscreen content, and non-critical resources to ensure they do not impact the interactivity of the main content.
Time to First Byte (TTFB)
What is TTFB?
Time to First Byte (TTFB) is a fundamental web performance metric that measures the duration from a user’s request to a webpage until the first byte of response is received from the server. TTFB is a critical indicator of the responsiveness and efficiency of a web server or network.
It encompasses the time taken for the server processing and the network latency between the server and the client. A lower TTFB means a website’s server responds more quickly to a user’s request, which is a crucial aspect of the site’s perceived speed.
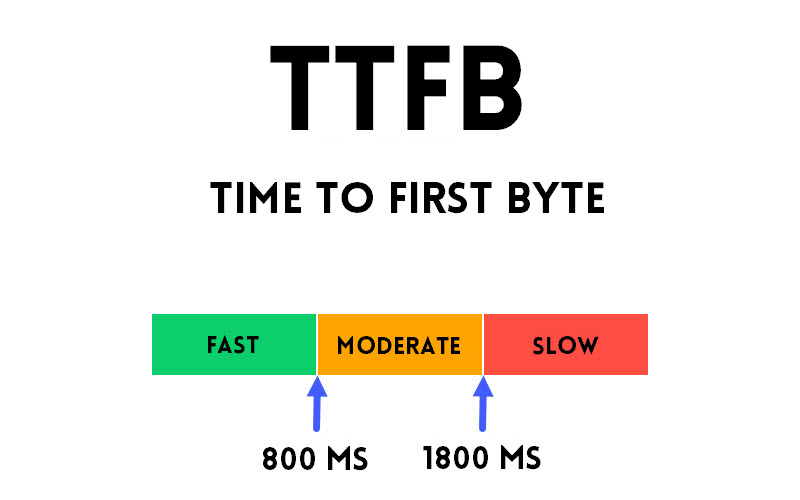
Since TTFB is an early-stage metric, it sets the stage for all subsequent loading events, including LCP. While TTFB is not a direct factor in LCP, it indirectly affects the time it takes for the largest content element to become visible to the user.
How to Optimize TTFB for Better Performance?
Optimizing for TTFB is all about your infrastructure setup, and the more you upgrade or optimize your server infrastructure, the better the TTFB will be.
- Optimize Server Performance: Enhance your server’s processing capability by ensuring efficient server-side code and proper resource allocation.
- Use Efficient Web Hosting: Choose a high-quality web hosting solution with good server performance and uptime. Upgrade your hosting if it lacks the necessary firepower to handle your website’s traffic.
- Implement a Content Delivery Network (CDN): Utilize a CDN to distribute the load and serve content from servers closer to the user’s location, reducing the network latency.
- Optimize Database: Regularly maintain and optimize your database to prevent bottlenecks.
- Reduce Server Load: Implement caching strategies to serve static content and reduce the load on the server. Optimize and compress your content to reduce the amount of data that needs to be transferred.
- Minimize HTTP Requests: Reduce the number of HTTP requests required for loading your webpage by consolidating files and using sprite sheets for images.
Total Blocking Time (TBT)
What is TBT?
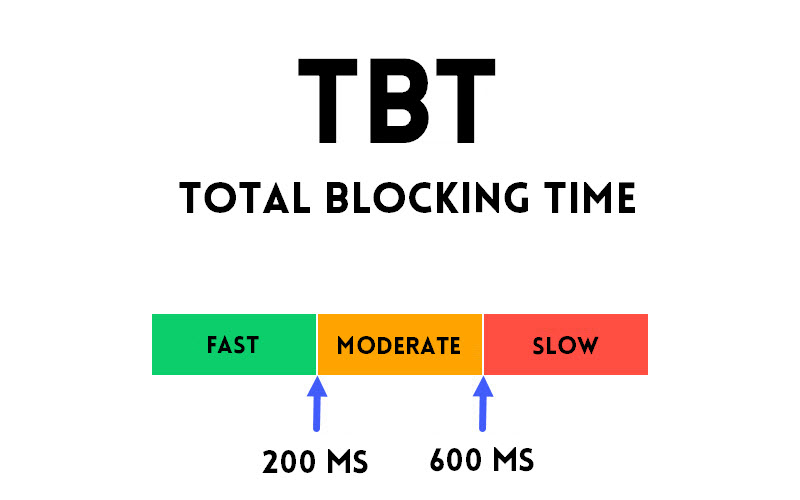
Total Blocking Time (TBT) is a web performance metric that measures the total amount of time between First Contentful Paint (FCP) and Time to Interactive (TTI), during which the main thread was blocked long enough to prevent input responsiveness.
TBT quantifies the sum of all time periods between FCP and TTI, where the main thread was blocked for over 50 milliseconds, preventing the user from interacting with the page. It’s an indicator of a website’s interactivity and responsiveness.
TBT supplements the Core Web Vital – First Input Delay (FID). FID measures the time from when a user first interacts with a page to when the browser is able to respond to that interaction. However, FID only captures the delay for the first interaction.
TBT provides a broader measure of the overall interactivity of the page during its loading phase, offering a more comprehensive view of the user experience. Optimizing TBT can, therefore, lead to improvements in FID, as both metrics are related to the responsiveness of a webpage.
How to Optimize TBT for Better Performance?
- Minimize Heavy JavaScript Execution: Break up long JavaScript tasks into smaller, asynchronous chunks to reduce their impact on the main thread. Optimize and defer the loading of non-critical JavaScript, allowing the main thread to remain more available for user interactions.
- Optimize Code Efficiency: Refactor and optimize your JavaScript code to make it more efficient, reducing the time it takes to execute.
- Limit Use of Third-Party Scripts: Audit and minimize the use of third-party scripts, which can significantly contribute to main thread blocking. Load third-party scripts asynchronously or defer their loading to reduce their impact on TBT.
- Prioritize Loading of Important Resources: Use resource hints like
preloadandprefetchto prioritize the loading of key resources that are critical for user interactions. - Reduce Render-Blocking Resources: Minimize and optimize CSS and JavaScript that block rendering. Use techniques like critical CSS extraction and deferring non-critical CSS.
- Performance Monitoring and Testing: Regularly use performance monitoring tools like Lighthouse and Chrome DevTools to measure TBT and implement optimizations based on their recommendations.
Speed Index (SI)
What is Speed Index?
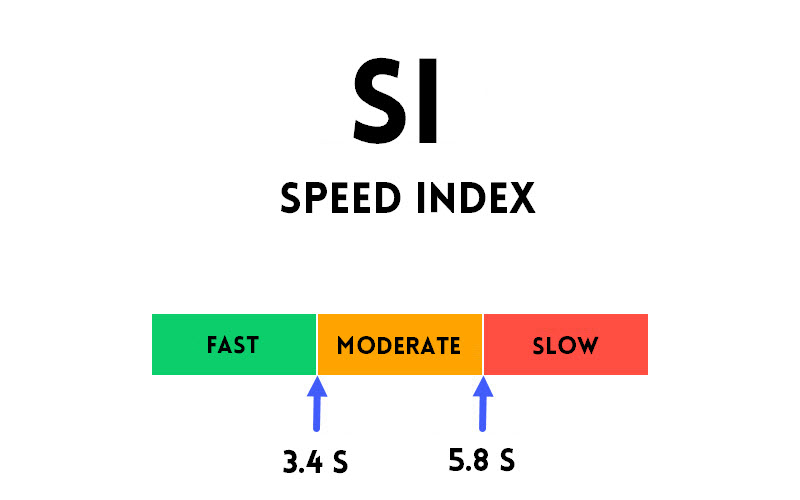
Speed Index is a performance metric that measures how quickly the contents of a webpage are visibly populated. It’s a key indicator of the user-perceived loading experience. Unlike other metrics that measure the load time of specific elements,
Speed Index assesses how quickly the entire content of a page becomes visible to users. It is calculated based on the visual progression of the web page’s rendering, capturing the average time at which visible parts of the page are displayed.
A lower Speed Index score means the page’s content is visually displayed more quickly, which is desirable for a good user experience.
How to Optimize Speed Index for Better Performance?
- Minimize Render-Blocking Resources: Identify and minimize the impact of render-blocking CSS and JavaScript. Use async or defer attributes for non-critical scripts and inline critical CSS.
- Reduce Server Response Times: Improve server performance and response times by using efficient hosting solutions, optimizing server-side scripts, and implementing caching mechanisms.
- Minimize or Reduce Main thread work: The rendering process involves parsing the HTML, CSS, and JS to build the page. The quicker the browser can complete this task, the better the Speed Index. So, defer the loading of JavaScript and non-critical CSS, and minify your JS and CSS files.
Tools for Measurement and Analysis
To measure and diagnose issues with key web performance metrics like Time to First Byte (TTFB), Total Blocking Time (TBT), First Contentful Paint (FCP), and Speed Index, a range of tools are available, each offering unique features and insights. Due to high variability, TTI as a metric has been removed from the lighthouse test.
Here’s an overview of some of the most effective tools:
1. Google PageSpeed Insights
- What It Does: Provides analysis of a page’s content and performance on mobile and desktop devices.
- Metrics Covered: Includes TBT, FCP, and Speed Index.
- Special Features: Offers both lab data for immediate analysis and field data for historical performance, along with actionable recommendations for improvement.
2. Lighthouse/ Chrome DevTools
- What It Does: An open-source, automated tool integrated into Chrome DevTools for auditing web pages for performance, accessibility, progressive web apps, and more.
- Metrics Covered: Reports on TBT, FCP, and Speed Index, among other metrics.
- Special Features: Provides detailed reports with performance scores and suggestions for optimizations.
3. WebPageTest
- What It Does: Allows for detailed testing of a page’s performance across different browsers and geographical locations.
- Metrics Covered: Offers detailed insights into TTFB, TBT, FCP, and Speed Index.
- Special Features: Enables advanced testing configurations, including custom scripts, multiple test runs, and visual comparisons.
Other Web Vitals Scores
| Metric | Green (Fast) | Orange (moderate) | Red (Slow) |
|---|---|---|---|
| FCP | 0-1.8 seconds | 1.8-3.0 seconds | Over 3.0 seconds |
| TTI | 0-3.8 seconds | 3.9 to 7.3 seconds | over 7.3 seconds |
| TTFB | 0-800 milliseconds | 800-1800 milliseconds | Over 1800 milliseconds |
| TBT | 0-200 milliseconds | 200-600 milliseconds | Over 600 milliseconds |
| Speed Index | 0-3.4 seconds | 3.4 to 5.8 seconds | Over 5.8 seconds |
Our Recommendations for Improving Web Vitals
Google’s John Mueller says that Technical SEO is not going away and should still remain a key part of SEO strategy. Keeping your web vitals in good shape must be at the top of your SEO task list, along with writing high-quality and relevant content for your audience.
So here are a few tips that can help you from our experience with web vitals over the last few years:
- Web performance is not a one-time fix but a continuous process. Keep testing your site regularly, and if you make any changes, make sure you do a speed test and verify the impact of the change.
- Even minor improvements in load times can significantly impact user experience and engagement. Small optimizations cumulatively lead to substantial gains.
- It is going to be tempting to design great-looking web pages. Resist it. You must strike a balance between feature-rich content and website performance. The KISS principle is very apt here and is the one to follow.
- With the increasing prevalence of mobile browsing, optimizing for mobile is not just an option but a necessity. Mobile-first designs and optimizations can significantly improve overall performance.
- Deploy a caching plugin. This will address many of the vital web recommendations straight out of the box. WP Rocket and FlyingPress are both good options.
- Use a CDN if you can afford it, especially if you have a global audience – FlyingCDN is an affordable option starting at $3/month. If you are using Cloudways, sign up for their Cloudflare add-on for an additional $5/month. It is worth it.
- Optimizing images is one of the quickest wins in web performance, significantly reducing load times without compromising on quality. Try Shortpixel or Imagify. If you are using a CDN with an image optimization service, enable it.
Wrapping Up
Understanding and optimizing non-core or other Web Vitals such as TTI, TTFB, TBT, FCP, and Speed Index is essential for a holistic approach to web performance.
While these metrics might not be in the spotlight as much as Core Web Vitals, their impact on user experience is undeniable.
By focusing on these additional metrics, website owners and developers can significantly enhance their sites’ overall functionality and user satisfaction.
Remember, a well-optimized website isn’t just about ticking boxes on performance metrics; it’s about delivering your users a seamless, efficient, and enjoyable experience.

